MM
Mary Mazza
Box Office Treasurer 38.0 hrs/week · $113,601
AR
Ali R Malekzadeh
Director 1.0 hrs/week
AC
Annette Cm Guzman
Director 1.0 hrs/week
AR
Arlene Regnerus
Director 1.0 hrs/week
BC
Bruce Crown
Secretary 2.0 hrs/week
CS
Chris Schuba
Director 1.0 hrs/week
ES
Edward S Weil III
Director 1.0 hrs/week
HM
Helen Melchoir
Director 1.0 hrs/week
JC
Joan Colmar
Director 1.0 hrs/week
KL
Katherine Lin
Director 1.0 hrs/week
KH
Kevin Hampton
Director 1.0 hrs/week
KH
Kevin Hoecker
Treasurer (Thru. 01/24) 2.0 hrs/week
KB
Kristina Blaschek
Treasurer (Begin 01/24) 2.0 hrs/week
MP
Marlena Peleo-Lazar
Director 1.0 hrs/week
MM
Matt McNicholas
Director 1.0 hrs/week
MM
Megan Morton
Director 1.0 hrs/week
MA
Mike Aden
Director 1.0 hrs/week
NH
Nicole Hayes
Director 1.0 hrs/week
PE
Patti Eylar
Vice Chair 2.0 hrs/week
RG
Robert Gordon
Director 1.0 hrs/week
RK
Roderick K Hawkins
Vice Chair 2.0 hrs/week
TR
Thomas R Baryl
Board Chair 10.0 hrs/week
TA
Tremaine Atkinson
Director 1.0 hrs/week
TG
Trudi Gentry
Director 1.0 hrs/week
General Operating Support
Support Us Here

Claim A Seat!
Learn More

Restoration Fund
Donate Here

Dance Partners
Join Today
Restoration Partners
More Info

Creative Engagement
Learn More
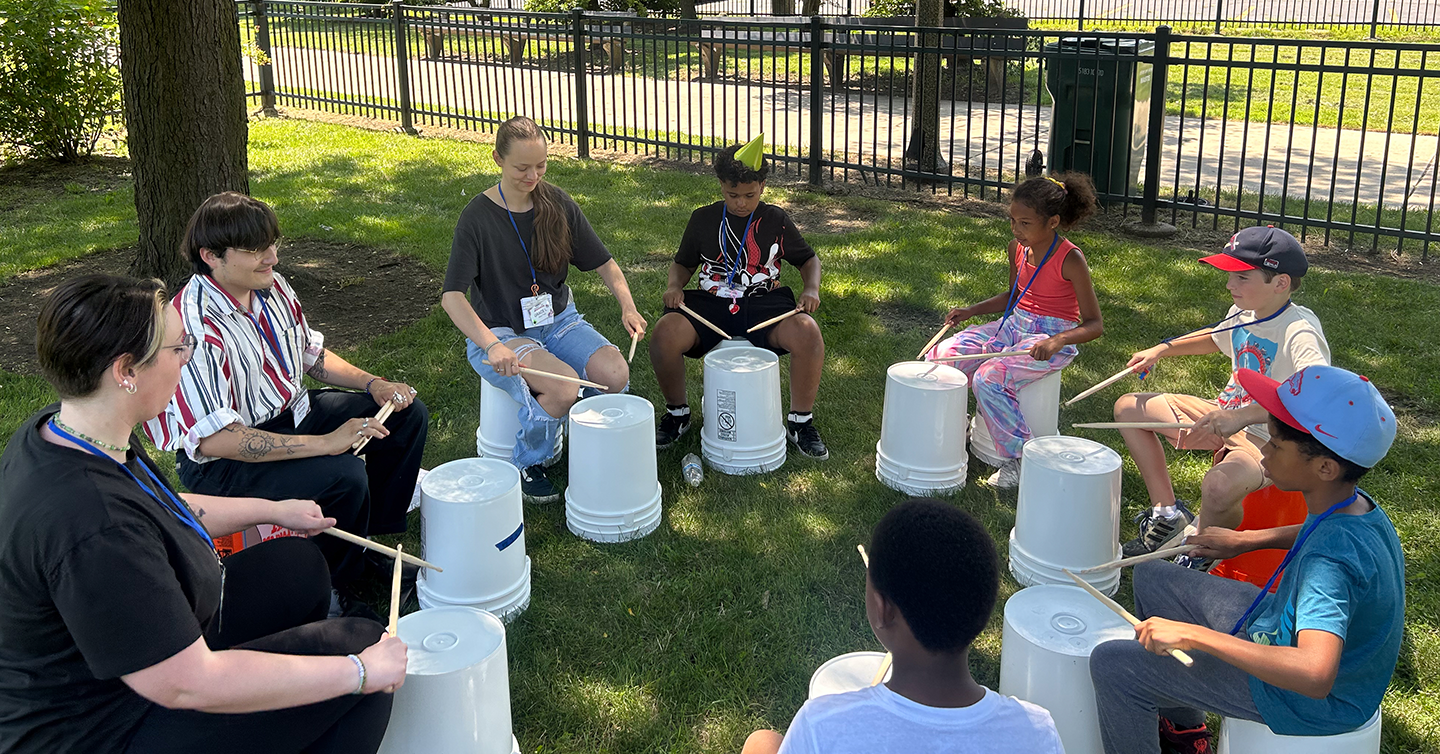
Hearts to Art Summer Camp
Donate Now